Forex Forecasting with Random Forests 2/N – Technical indicators
Economy
## Feature creation/processing
#- Addition of technical indicators
#- Creation of statistics that may be valid for each variable
#- Differences in historical performance (e.g. price difference from a week ago)
#- Date processing (e.g. holidays, days of the week)
## Feature creation/processing
#- Addition of technical indicators
#- Creation of statistics that may be valid for each variable
#- Differences in historical performance (e.g. price difference from a week ago)
#- Date processing (e.g. holidays, days of the week)
# Technical indicators to be calculated
Date = np.array(df_drop['Date'])
high = np.array(df_drop['eurusd_High'])
low = np.array(df_drop['eurusd_Low'])
close = np.array(df_drop['eurusd_Close'])
prefix = 'eurusd'

# Additional technical indicators
df_technical_indicators = calc_technical_indicators(Date, high, low, close, prefix)
df_drop_add = pd.merge(df_drop
            ,df_technical_indicators
            ,on='Date'
            ,how='left').dropna(how="any")
print(df_drop_add.shape)
### Date processing
# Extract date year, month and day of the week (0 for Monday, 6 for Sunday) information
# Convert to dummy variable
df_drop_add =df_drop_add.assign(
#             year=df_drop['Date'].dt.year
            month=df_drop['Date'].dt.month
            ,weekday=df_drop['Date'].dt.dayofweek
            ).pipe(lambda df: pd.get_dummies(df, columns=['month','weekday']))
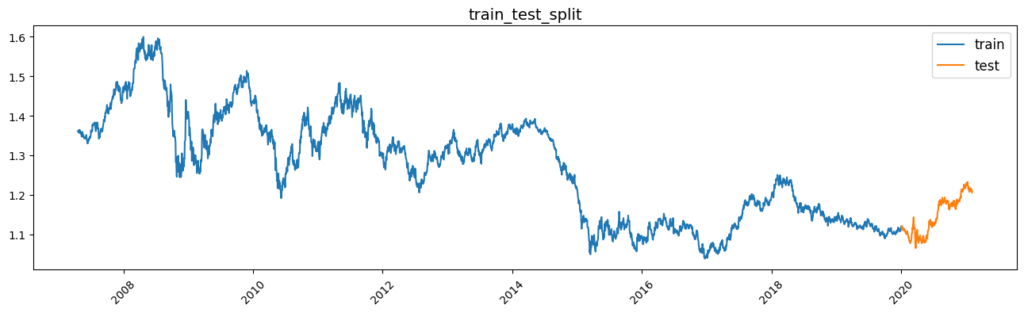
### Validation
# Validate while maintaining the sequence of time-series data, as next day's data may be mixed in the TRAIN and it is easy to over-learn when randomly partitioning with time-series data.
split_day = dt.datetime(2020,1,1)
df_tr = df_drop_add[df_drop_add['Date'] < split_day]
df_te = df_drop_add[df_drop_add['Date'] >= split_day]

X_train = df_tr.drop('Maguro', axis=1)
Y_train = df_tr['Maguro']

X_test = df_te.drop('Maguro', axis=1)
Y_test = df_te['Maguro']
### Range visualisation for train and test
fig, ax = plt.subplots(figsize=(16, 4))
ax.plot(X_train['Date'], X_train['eurusd_Open'], label='train')
ax.plot(X_test['Date'], X_test['eurusd_Open'], label='test')
ax.legend(fontsize=12)
ax.set_title('train_test_split', fontsize=14)
# ax.xaxis.set_major_locator(mdates.MonthLocator(interval=12))
# ax.xaxis.set_major_formatter(mdates.DateFormatter('%y/%m'))
ax.xaxis.set_tick_params(rotation=45)